By RSMR
Independent research business RSMR has added a new RSMR Responsible Growth portfolio to its Responsible Managed Portfolio Service (MPS). There are now four risk profiled portfolios in the RSMR Responsible MPS in Dynamic Planner – alongside the RSMR Rfolios MPS range of risk profiled portfolios.
Stewart Smith, RSMR Head of Managed Portfolio Services, said: “The RSMR MPS offers advisers attractive, cost-effective options to align with the most frequently selected investor risk profiles in Dynamic Planner.
“The RSMR Responsible portfolios provide a pragmatic solution for advisers seeking greater exposure to responsible investment supported by a rigorous fund research process.”
What is RSMR’s approach to ESG?
Stewart Smith: “ESG factors represent potential risks to any fund’s holdings, irrespective of the fund’s badge. Therefore we consider ESG to be an integral part of the research process for all funds we assess, monitor and ultimately rate.
“RSMR introduced Responsible fund ratings back in 2012 (called SRI ratings at the time and subsequently renamed) in response to demand. For us, funds with a Responsible rating go beyond ESG investing with each of the 44 RSMR Responsible rated funds needing to satisfy our additional criteria.
“As part of our Responsible fund rating process, we determine which of the four RSMR Responsible categories the fund belongs in. Funds can then be further subdivided at a more granular level.”
- Sustainable – Funds that select and include investments on the basis of responsibly contributing to and benefiting the global sustainable economy. This may include referencing the portfolio to one or more of the UN Sustainable Development Goals (SDGs) or the application of a screen.
- Impact – Funds that can demonstrate they are aligned to the Global Impact Investing Network’s definition of Impact, ‘Investments made with the intention to generate positive, measurable social and environmental impact alongside a financial return’.
- Thematic – Funds that use macro themes to identify long-term responsible structural growth trends.
- Ethical – Funds that apply a screen, either positive, negative or both, that may be based on ethics or on a ‘best in sector’ approach. Each fund will have its own defined screen and may vary between providers.
How did the RSMR Responsible MPS come about?
Stewart Smith: “As the RSMR Responsible fund universe continued to grow, we launched the RSMR Responsible Balanced Portfolio in June 2016, initially as an advisory portfolio but then converted to a discretionary portfolio in March 2018, at which point we also added the Responsible Cautious and Responsible Dynamic portfolios.
“We have been running standard and Responsible (or SRI) client portfolios comprising RSMR rated funds for advice businesses much longer than that.
“We have taken the opportunity to broaden our offering in the Responsible investing area through the launch of the Responsible Growth Portfolio, which means we can offer advisers four RSMR Responsible portfolios, risk profiled by Dynamic Planner at risk levels 4, 5, 6 and 7 respectively.”
How does RSMR construct and manage its MPS?
Stewart Smith: “RSMR’s MPS investment approach is designed to be easily explained by the adviser and easily understood by the client, and has achieved strong and consistent past performance.
“It begins with putting together a strategic asset allocation for each portfolio. The intention is for this to be relatively stable over time and not be influenced by any market timing decisions.
“Ours is a forward-looking approach, considering the various longer-term risk and return expectations for the relevant asset classes relative to their history. Our information and data are drawn from a wide range of industry sources to form a consensus of the investment factors which may drive returns in the future, for example valuation levels, interest rate and inflation expectations, economic growth rates and so on.
“Whilst we hold formal discussions on asset allocation quarterly, any new information relevant to asset class views, and any potential portfolio fund changes, are frequently discussed within the RSMR team.”
What does the Responsible Growth portfolio look like?
Stewart Smith: “While our allocations and fund choices will vary over time, the initial asset allocations are 37.5% International Equities, 27.5% UK Equities, 26.0% Fixed Income, 5.0% Multi-Asset and 4% Cash. The Portfolio’s IA benchmark will be Mixed Investment 40-85% Shares.
“Our fund selections include some of the larger fund management groups who have been active in responsible investing for a number of years. There are also funds from lesser known groups who have equally strong pedigrees and often provide more specialist exposure.”
Find out more: www.rsmr.co.uk/about-us/services
RSMR Portfolio Services Limited is a limited company registered in England and Wales under Company number 7137872. Registered office at Number 20, Ryefield Business Park, Belton Road, Silsden BD20 0EE.
RSMR Portfolio Services Limited is authorised and regulated by the Financial Conduct Authority under number 788854. © RSMR 2021. RSMR is a registered Trademark.
The team at Dynamic Planner have grown rapidly during Covid, meaning many members began roles in varying levels of lockdown in the UK. However, the award-winning firm’s commitment to remote and hybrid working has helped new starters hit the ground running in the field of financial planning technology.
Amanda Thorpe is currently Product Owner for parts of Dynamic Planner, which deal with annual reviews and recommendations for retail investors. She joined in May 2021, having previously worked as a chartered tax adviser and then as a product owner for a tax return software company.

What was it like starting a new job during the pandemic?
It’s actually not been that weird. It’s a nice place to work, very friendly. There’s a good programme here in the first few weeks, with sessions with representatives from different departments who talk you through what they do, which helped with understanding the business. My first day, I was lucky enough to go into the office for a meeting. Then, when the restrictions allowed, a few of us started going into the office on Thursdays, just because it’s good to do some things in person.
How long did it take you to feel confident in your new role?
At first it felt like there was a lot to learn, but I focused on how I was changing and progressing month to month. By the end of month three I felt that I could have conversations with our clients in which I really knew what I was talking about. This company is very, very good at getting feedback from customers, so there’s a lot of client interaction in my role, which is really useful for what we’re trying to achieve.
What do you think might attract other people to Dynamic Planner?
Probably the fact that the company is growing and everyone is feeding into it. Even in the six months I’ve been here, we’ve gone through changes where we’re trying to figure out what processes work best, what improvements we can make, how we can get the most out of what we’re doing. There’s an opportunity to really shape where the company is going.
Visit our careers page to view our latest vacancies
“We are on the cusp of a Golden Age for the financial planning industry, with a mixture of demand, regulation and technology providing the backdrop against which financial advice and planning is made more accessible than ever before,” says Ben Goss, CEO Dynamic Planner.
Speaking at Dynamic Planner’s 10th Annual Conference, Ben Goss continued: “More than four million people took financial advice in 2020, growing rapidly year-on-year as people considered their priorities as well as their portfolios during the pandemic.
“The Regulator and the Treasury both want to see more people accessing the financial advice they need to make long term investment decisions, and combined with the huge adoption of Internet and video communication over the last two years, advice firms with the right systems now have an unprecedented opportunity.
“They can now open up capacity to the benefit of their clients, the benefit of their business and, in removing much of the manual work associated with financial planning, make their working lives more fulfilling.
“However, challenges remain: regulation continues to evolve, this year with Consumer Duty, fragmented systems all too often cause wasted energy and increased risk of error and advisers need to find new ways to demonstrate their value when they are not in the room with the client. How can firms do this?
“Three years ago, Dynamic Planner embarked on a multi-million-pound upgrade to deliver the one financial planning system firms need in a hybrid world. We have since launched a range of new developments from sustainability profiling to risk-based cash flow planning.
“We are grateful for the contributions from hundreds of firms across our client base, at every stage of the design and development process, ensuring that Dynamic Planner is a system built with financial planners for financial planners.
“Today and over the coming weeks and months, we are launching a range of new innovations to deliver on our one system vision and ensure that firms thrive in the hybrid world.”
New innovations from Dynamic Planner include:
- Client Access: enhancing Dynamic Planner’s market-leading client profiling solution is the capability for firms to ask clients to complete the financial planning KYC process remotely on a secure, white labelled web app. Client Access is intuitive and engaging for the client and maximises efficiencies for the firm by feeding data back into Dynamic Planner to support the profiling, cash flow and review processes. It can be used in conjunction with an existing client portal.
- Open API: Dynamic Planner has launched an open API programme enhancing its existing API capability to make it even easier for third party firms to integrate. Open API tackles the challenges around data fragmentation and further streamlines the process of obtaining and reporting accurate valuations for advice firms. The first integration to the Open API will be with Time4Advice’s Curo CRM.
- Target Market Product and Platform Research: building upon Dynamic Planner’s outstanding investment research capability, new functionality enables advice firms to objectively research products, platforms and providers from across the whole of market, and map those to target markets in line with PROD requirements, streamlining the advice process all within one financial planning system.
Want to see what Dynamic Planner can do for you? Schedule a free, no-obligation demo and experience the full functionality of Dynamic Planner.
By Jim Henning, Head of Investment Services, Dynamic Planner
Concerns over the rising pace of inflation have seen interest rates start their gradual climb and the beginning of the end of the great financial experiment by central banks, referred to as quantitative easing.
This raises a number of questions for those clients relying on natural income in their retirement:
- How durable is the portfolio’s income and underlying capital, post the era of fiscal stimulus and interest rate manipulation since the Great Financial Crisis of 2008 and the Covid-19 pandemic?
- What is the nature of expected risks with the underlying assets, particularly within the fixed income space given their elevated sensitivity to interest rates changes?
- There has also been strong growth in demand for alternative asset classes, such as investment in infrastructure, to drive the transition to a clean, low carbon economy and generate an attractive yield. How can risks be assessed accurately?
Dynamic Planner’s Income Focused Fund Research Reports might just help you out at the next client annual review.
The latest set of six, monthly reports provide a wealth of research, both in terms of how the solution has delivered historically and also what types of risks the portfolio manager is taking from a forward lens perspective.
This research is only possible because of the in-depth risk profiling performed at individual holdings level by the Asset & Risk Modelling Team at Dynamic Planner. The reports also share detailed content as to process and philosophy adopted by the management team running the assets.
As the recovery from the Covid recession gathers pace, we can see how income payments from this subset of risk profiled funds have stabilised over the last year. Below, the net income paid by the Risk Profile 5 income focused funds over the last five years are shown (specifically the median and the mid 50% range).
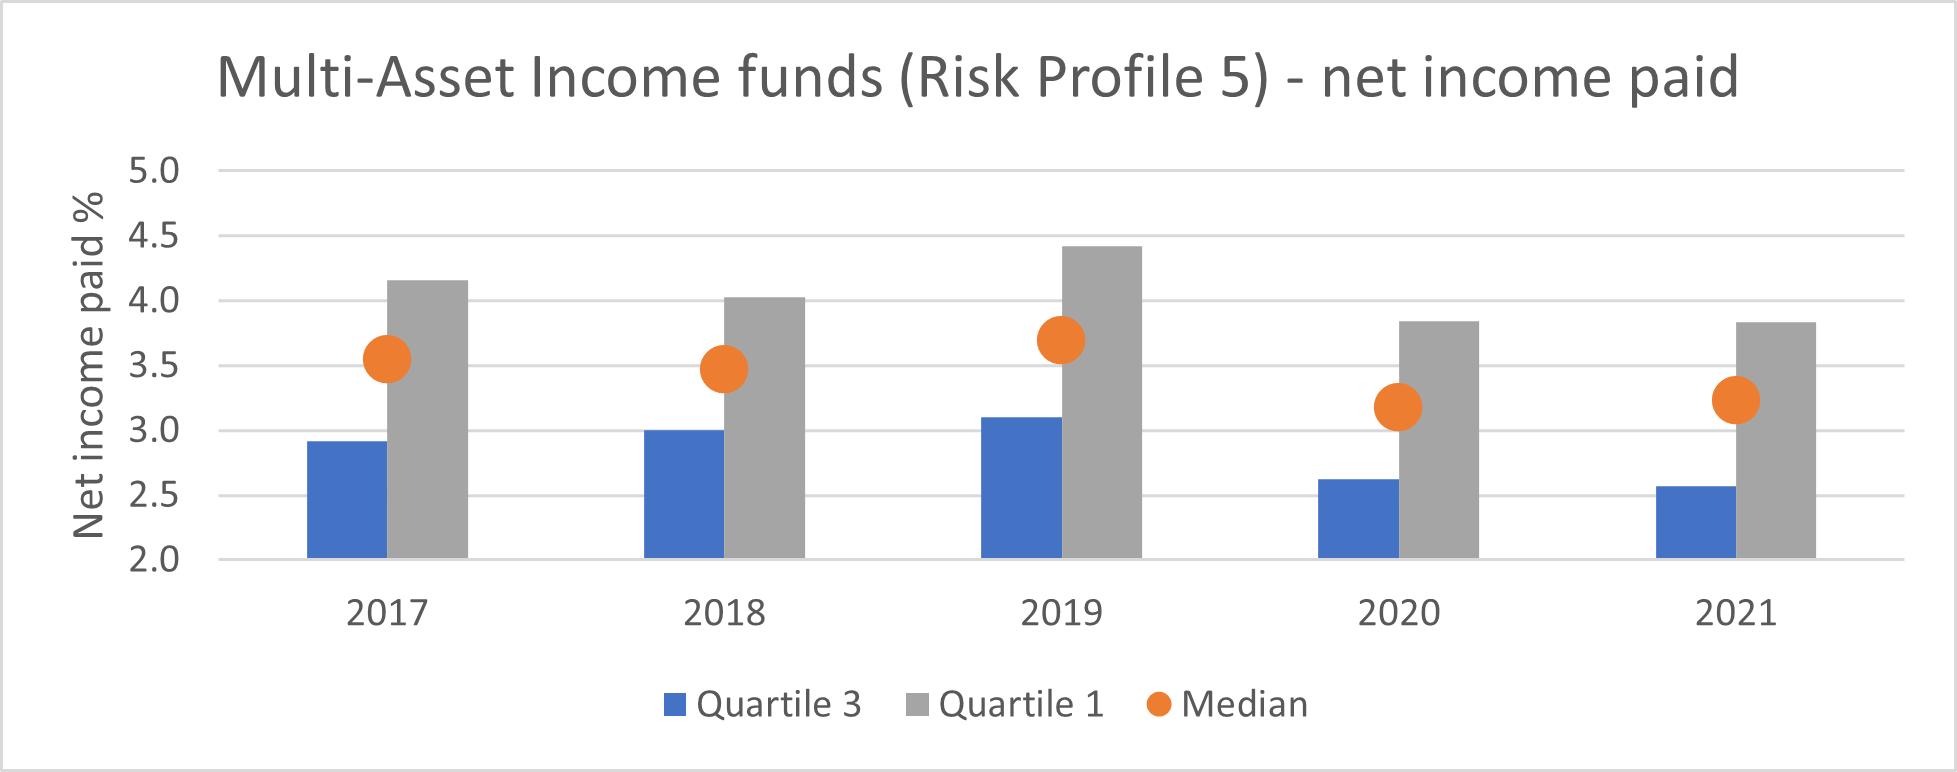
Source: Lipper Refinitiv, 12mth periods to end Jan each year
When it comes to talking about risks, your clients may be interested in widening the discussion to ESG.
If so, try Dynamic Planner’s sustainability questionnaire, launched last March and take a look at the MSCI ESG fund ratings available in the system. Using the above income focused Risk Profile 5 funds, it’s encouraging to see the MSCI fund ratings are predominantly AA and A, indicating the high quality of the underlying investee companies managing ESG risks (relative to their sector / industry peers) held within the portfolios.
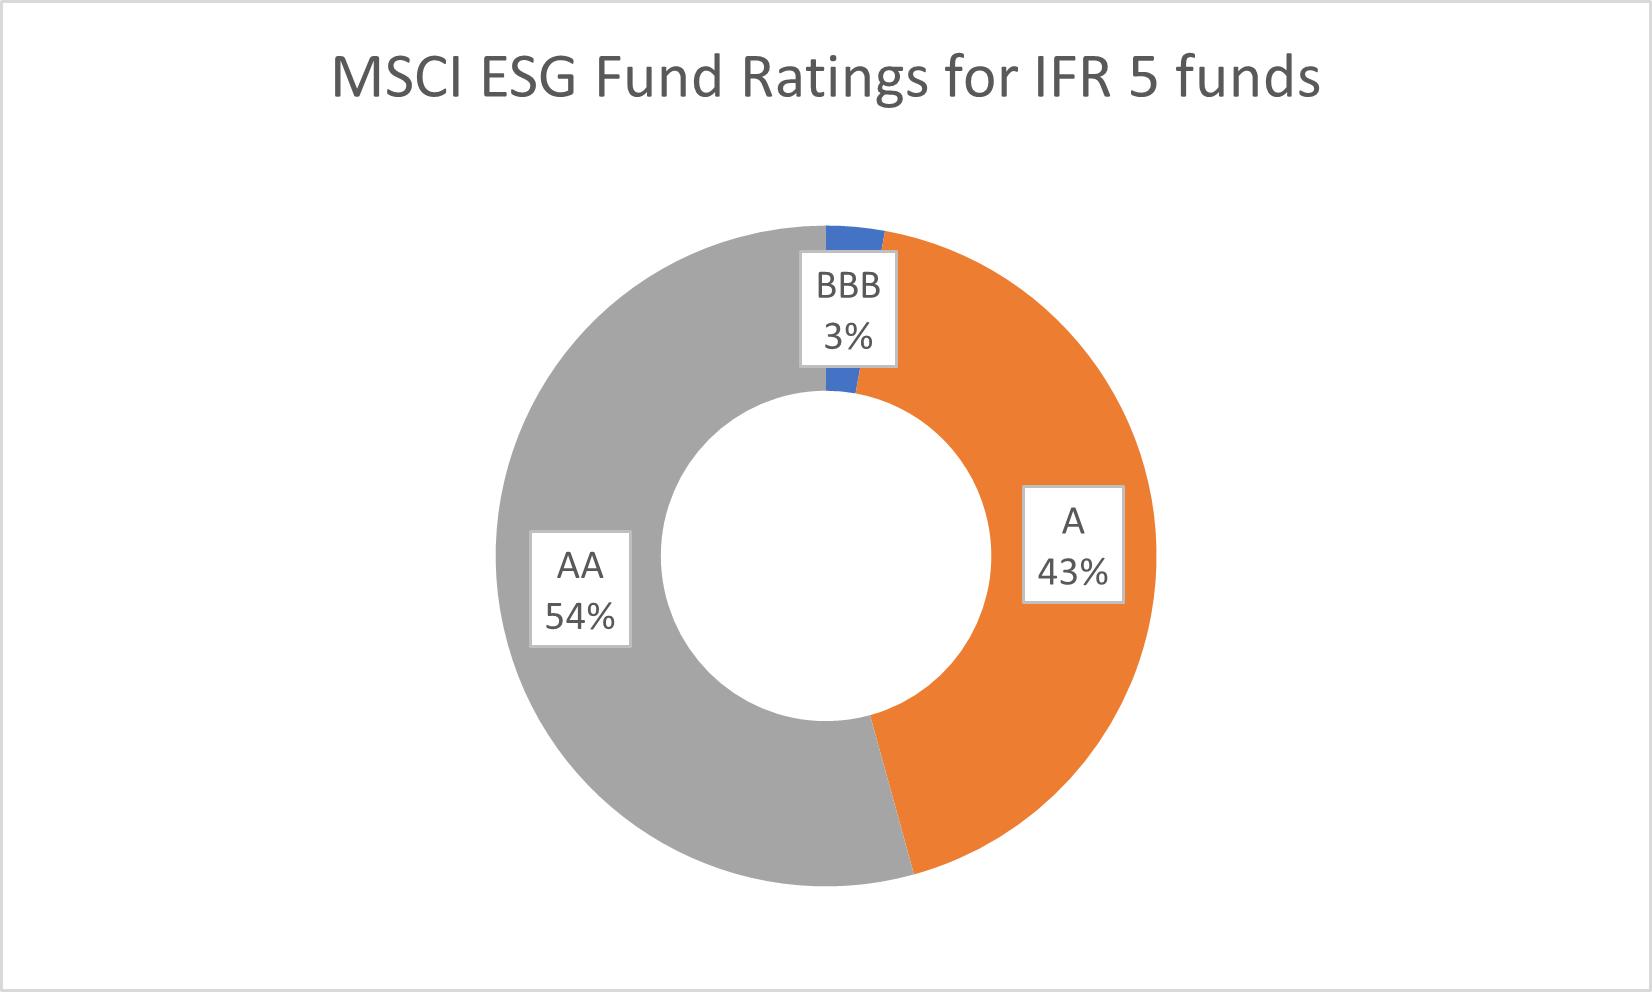
Source: MSCI at end Jan 2022
The latest Income Focused Fund Research Reports are set to be available from Friday [11 Feb] in the latest version of Dynamic Planner for the following funds:
| Risk Profile | |
| BMO MM Navigator Distribution | 5 |
| Legal & General Multi-Index Income 4 | 4 |
| Legal & General Multi-Index Income 5 | 5 |
| Legal & General Multi-Index Income 6 | 6 |
| M&G Episode Income | 5 |
| Premier Miton Multi-Asset Distribution | 5 |
| Premier Miton Multi-Asset Growth & Income | 6 |
| Premier Miton Multi-Asset Monthly Income | 5 |
| Rathbone Multi-Asset Strategic Income | 5 |
| Santander Atlas Income | 4 |
| Schroder Monthly Income | 5 |
| VT Momentum Diversified Income* | 5 |
| UBS Global Diversified Income | 5 |
*Coming soon
By Sam Liddle, Sales Director, Church House Investment Management
The absolute return sector has always had its critics and, in the case of several participants in the sector, rightly so. But in a year that looks set to challenge both equity and fixed income markets, could the strategy come back into its own?
So far this year, much airtime has been handed to discussions around which style of investing, asset class, or region will dominate from a performance standpoint in 2022. The reality is, it’s a uniquely difficult time for both growth and income investors, as both equity markets and fixed income assets face uphill struggles.
This is when a traditional multi-asset absolute return strategy, managed appropriately, may well prove a sanctuary for investors looking to beat inflation, while also offering capital preservation to income investors.
The number one challenge
Inflation is the main bugbear for the moment and a particularly difficult one to tackle. It is not just a UK problem, US inflation in December was reported at an annual rate of 7%.
The bounce-back in world economies last year led to an equally rapid rise in energy prices and this is now being made worse by supply constraints, which means we do not see an immediate catalyst for a correction of this rapid rise.
But we do expect economic growth to continue in 2022 on both sides of the Atlantic, which should lead to further earnings growth for companies. Ultimately, this is what will drive markets in 2022 (as ever) but we expect a bumpy ride. This lack of visibility can give rise to increased volatility, particularly in risk assets like equities, meaning returns easily become inconsistent.
How volatility and uncertainty affect investors
This may not be so much of an issue for younger investors, as they hopefully have time for investments to recover before they need access to their capital. But for older investors, particularly those looking to draw an income, it can become a significant problem.
Take a retiree making regular drawdowns from their pension pot to maintain their lifestyle. If a risk event sends equity markets horribly south, and they are heavily exposed to them, it could not only reduce the value of their savings, but also put them at threat of ‘pound-cost ravaging’.
This is a phenomenon whereby they are forced to sell larger and larger portions of their pension pot to maintain their preferred level of income while the underlying value of that pot continues to fall.
Contending with inflation, now sat at a decade-high level of 5.4%, means the income they are drawing down also has less spending power.
Absolute clarity
While this all seems rather gloomy, this is where the multi-asset nature of absolute return investing can really come into its own. Funds in the sector can vary considerably in style, objective and, indeed, success, but being able to invest across a spectrum of assets allows skilled investment managers to pick the right opportunities and weight their portfolios in accordance with their clients’ expectations.
This diversification, if done correctly, can help shield the risks associated with investing in an individual strategy, style, sector, or region and serve as an outsourced asset allocation solution in difficult volatile markets. It means investors can hope to avoid the risks of being overexposed to market volatility by having a large exposure to cash. Then, to mitigate the risk of capital erosion this creates, complement this cash allocation with growth and income positions in assets like equities and floating rate notes (FRNs).
How to identify absolute return ‘purists’
It is vitally important in this sector to separate the pure absolute return funds from the ‘quasi’ absolute return funds. The past has shown that when markets are volatile, it has been easier to see which funds have the most risk on the table. We have always believed that in a volatile environment, the pursuit of growth while disregarding capital preservation seems like a reckless strategy.
To our mind, an absolute return fund should have a number of key characteristics: first, it should start with cash. Then, every investment beyond cash should offer compelling reward potential for an appropriate level of risk. If, in volatile and uncertain market conditions, there are relatively few opportunities that meet those criteria, holding higher weights in cash or near-cash instruments seems sensible.
Investing on an absolute return basis should mean ensuring every investment is made with an awareness of the downside risk. Many funds adopt a ‘rolling three-year’ absolute return target, leaving investors to suffer significant volatility in the interim. There is always the danger that having waited three years, investors don’t get the absolute return they wanted either but by then it is too late.
Instead, we continue to target a positive return over rolling 12-month periods, employing ‘patience’ as an investment strategy – a seemingly under-used strategy of late. Reverting to near cash when short-term volatility looks extreme, or valuations in other asset classes are untenable and simply waiting until they become compelling, seems the pragmatic approach.
This is important because of the impact significant drawdowns can have on long-term returns. The greater the amount lost, the higher the gain required to break even, and who knows when markets might return to normal.
The above article has been prepared for investment professionals. Any other readers should note this content does not constitute advice or a solicitation to buy, sell, or hold any investment. We strongly recommend speaking to an investment adviser before taking any action based on the information contained in this article.
Please also note the value of investments and the income you get from them may fall as well as rise, and there is no certainty that you will get back the amount of your original investment. You should also be aware that past performance may not be a reliable guide to future performance.
By Sonja Laud, Legal & General Investment Management
Even though we’re only a few weeks into the new year, investors have already seen some significant moves in markets. In a special CIO call, we discussed how they might play out.
Last week I sat down with Colin Reedie, Head of Active Strategies, and Tim Drayson, Head of Economics, for a live webinar with clients to assess the investment outlook for 2022 in light of recent market and macro developments.
You can listen to an audio version via LGIM’s podcast channel on Apple, Spotify, our website and Audioboom, where the first instalment of our two-part outlook series is also available. During the call, we made the following key points.
Accelerating change
Society could be on the cusp of another ‘Roaring Twenties’, amid the global economic recovery and rapid technological change. That’s because each successive wave of COVID-19 appears to have a lower impact on economic growth, while the pandemic – which has fundamentally altered how we live, work and play – has accelerated key themes of which investors need to be aware.
We will, of course, continue to research and engage on the associated environmental, social and governance issues. This year, among other topics, our Global Research and Engagement Groups will focus on climate change, as well as inequality, cybersecurity, health and obesity.
Hear from Sonja, Tim Drayson and Colin Reedie
Inflation implications
While inflation is likely to ebb from current levels, it’s unclear whether and when it will return to target. It could remain stubbornly high, in economies at full capacity, triggering further upward pressure on wages.
Markets appear to be underestimating either how high interest rates need to go, or how stubborn inflation will be. This means 10-year US Treasury yields could rise materially, in our view.
Growing volatility
We expect greater market volatility this year, as central banks balance the risk of tightening policy too far, too fast versus the danger of being behind the curve on inflation. Indeed, a hawkish pivot is already underway at the US Federal Reserve, while we believe the Bank of England may raise rates again in February.
Disclaimer: Views in this blog do not promote, and are not directly connected to any Legal & General Investment Management (LGIM) product or service. Views are from a range of LGIM investment professionals and do not necessarily reflect the views of LGIM. For investment professionals only.

Will McIntosh-Whyte, manager of Rathbones’ range of four risk-rated sustainable multi-asset funds, answers questions about why sustainable investing makes sense, what he hopes to achieve with this range and what some of the challenges and opportunities are in managing sustainable multi-asset portfolios.
1. Why is sustainable investing gaining traction?
There’s no denying that demand for sustainable investing has risen sharply. This has been driven in large part by people wanting to not only reflect their values in their investments, but also make a positive impact with them. The trend has been given extra impetus from regulatory changes requiring advisers and investment managers to add environmental, social and governance (ESG) considerations to their suitability checks. So yes, sustainable investing is on the rise, but how you go about it is crucial – how do you know if your approach is truly sustainable, for the planet and for investment returns?
2. How can you cut through the noise and green-signalling to identify what is truly sustainable?
Though it’s rarely acknowledged, there is lot of grey area, nuance and subjectivity involved in analysing companies for their sustainability credentials. It requires an active, common-sense approach by those who have experience and expertise in the area. For this reason, our day-to-day management of the Rathbone Greenbank Multi-Asset Portfolios (RGMAPs) is supported by Rathbone Greenbank Investments (Greenbank), who have been pioneers in the development of sustainable investing since 1997. Their ethical, sustainable and impact (ESI) research team use their proprietary database of profiles on companies, governments, and other entities to independently scrutinise every asset in our funds against our pre-determined and clear sustainability criteria. The Greenbank team analyses the specific merits of each entity’s activities in detail and how it addresses sustainability and responsible business issues, as well as the quality of its response. This ensures our funds only invest in ways that are truly aligned with the UN’s Sustainable Development Goals (SDGs), an agenda for global sustainable development adopted in 2015 by all UN member states.
Just to give one example of the complexities involved, take the full lifecycle of an electric vehicle. When you delve into it, you start to uncover some difficulties from a sustainability perspective, such as the cobalt mining that is necessary for making the batteries. Often, only relying on third-party ESG ratings and not doing your own in-depth analysis, can mean missing some of these crucial sustainability issues. This is one of several challenges that our stewardship team have been exploring in a series of articles for our quarterly InvestmentInsights publication.
3. What are the benefits & drawbacks of using third-party ESG data?
While we do use ESG data from external providers as part of our analysis, we do not rely on that alone. We find these external sources a useful starting point for our own research as it can be a quick way to identify red flags that would rule something out or highlight areas of operational strength or weakness to investigate further. We’re also able to take some of the raw data points such as health and safety stats, emissions, etc. and feed them into our own database. As with any external information source, it’s important to understand the methodology used in order to know what the data is and – more importantly – isn’t telling you. For example, some ESG ratings are relative to individual sectors and are highly dependent on what issues (e.g. data security, climate change, employee relations) that the data provider has determined to be most important for that sector. In some cases we find quite a good alignment between their views and ours, but often we’ll have quite a different view. There can also be a bias in external ratings towards companies that report more information. A company might get a poor score not because it’s worse than its peers, but because it just isn’t putting as much information into the public domain. So it’s important to do further digging.
Our in-house research into organisations draws on company reports, monitoring of news flow, company meetings, NGO reports and other third-party sources. These include specific benchmarks and data sources such as environmental impact tracker CDP’s scoring, Workforce Disclosure Initiative and Access to Medicine Index. Researching a company’s sustainability credentials involves a great deal of data analysis as well as qualitative research. We of course have an objective framework for rating companies from a sustainability point of view, but we think it’s crucial to always have a human sense check at the end.
4. Can you tell us more about your criteria, and how you define ‘sustainable’?
For us, sustainable means investing in companies and entities which are benefiting people and planet by working in ways or providing goods and services that support sustainable development. To do this in practice, all equities and corporate bonds within our portfolios must align to one of Greenbank’s eight sustainable development categories which map to the UN SDGs. These eight categories focus on crucial areas of sustainability such as energy and climate, health and wellbeing and resource efficiency. We also believe that some areas are simply inconsistent with sustainable development, which is why we screen them out of our portfolios. For us, oil and gas companies and miners don’t belong in sustainable funds.
We believe it is important to apply sustainability criteria to all asset classes. We use a customised criteria for more complex asset classes, for example government bonds and commodities, rather than simply excluding them fully or alternatively compromising on sustainable values.
Importantly, Greenbank can veto investments which do not meet our funds’ responsible investment policy, ensuring it’s applied without bias or influence from us, the fund managers. Equally the team, supported by Rathbones’ wider stewardship resource, continues to actively undertake stewardship activities such as voting, engagement and monitoring on behalf of our investors.
5. Can you achieve true diversity in a sustainable portfolio? Doesn’t the sustainability criteria limit your choices?
We believe it is not only possible, but necessary to create sustainable portfolios that are genuinely diversified. It’s simply not enough to just be ‘sustainable’. Everything in the portfolio has to either generate a return or hedge a risk, and you need to have the right balance of both. What we don’t want to be is just another questionably diversified ‘60-40’ fund with a sustainable badge thrown on it.
Given that all investments must support sustainable development, providing diversification while keeping true to your sustainability principles can be done, it just takes a little more work. For instance, government bonds are an important tool for multi-asset portfolios, and we believe they have a place within sustainable portfolios too given the significant positive impacts governments can have on the environment and society. But, for their bonds to be eligible for inclusion in our funds, countries must pass three out of four of our sustainable qualifying criteria related to military spending, corruption, civil liberties and climate change action. While bonds are available to help diversify our portfolios, the universe is reduced – for example, US Treasuries are currently ineligible for inclusion because of the American government’s inaction on climate change and heightened defence spending. But Japanese and UK government bonds have passed our criteria and are held right now. However, there are supranational bonds in many countries and currencies that can offer similar exposure to sovereigns, but in a more sustainable way. Another asset class with current limitations is commodities. They can be particularly valuable as a hedge against inflation. However, it is difficult to ensure they align to sustainable development due to their mining processes. So, to diversify and hedge risks that commodities and similar assets would provide, we can use other tools, such as foreign currencies and structured products, that balance our risks without compromising our values.
In order for our funds to be able to invest in commodities (apart from fossil fuels, which are excluded due to their damaging impact on the climate) we have created a set of sustainability criteria which they must meet. These include providing supply-chain transparency, with independent verification that there are no significant issues regarding labour rights, human rights or environmental degradation across the supply chain. Due to our strict criteria, commodity investments are excluded from our portfolios for now. However, we believe as we continue to transition to a more sustainable world over time there may be some commodities which meet the criteria, so we’re not ruling them out for future consideration.
6. How does risk management for sustainable multi-asset portfolios compare with managing risk for a traditional multi-asset portfolio?
In order to construct portfolios effectively and manage risk, we use our forward-looking Liquidity, Equity-type risk and Diversifiers (LED) framework, which is the same one we’ve been using for years in our other multi-asset portfolios. Because fixed income, equities and alternative investments can behave in different ways, even compared with similarly labelled investments, we want to make sure that assets are categorised by their liquidity and correlation to equities, particularly during periods of market stress. This helps protect our portfolios adequately and limit drawdowns.
For example, within the Equity-type risk bucket we include investment grade corporate bonds and high yield bonds, alongside equities. We do this because during a market downturn these bonds tend to correlate highly to equities and therefore are unlikely to provide much protection when you need it most. This must be considered carefully when constructing a portfolio.
We use several other tools to manage risk. These include assets within our Diversifiers bucket that can provide returns that are uncorrelated to equities, for example put options and structured products linked to interest-rate volatility or currency momentum. These assets aren’t considered Liquidity assets because they don’t have the same ease of buying and selling quickly in stressed markets compared with, say, developed market government bonds. We also have the ability to hedge our currency exposure, enabling us to choose the best companies globally and only take the currency exposures we want. For example, we can retain exposure to the yen, which tends to act as a safe haven during difficult markets, as a risk-management tool.
You can read more about the Rathbone Greenbank Multi-Asset Portfolio range; speak with your usual Rathbones representative; or contact the team on 020 7399 0399 or at rutm@rathbones.com
This is a financial promotion relating to a particular fund range. Any views and opinions are those of the investment managers, and coverage of any assets held must be taken in context of the constitution of the fund and in no way reflect an investment recommendation. Past performance should not be seen as an indication of future performance. The value of investments may go down as well as up and you may not get back your original investment.
It’s been difficult to catch up on the news lately without seeing headlines of inflation hitting 30-year highs. But are we heading back to the 1990s? What can be done? And does inflation even matter in financial planning, asks Steph Willcox, Head of Actuarial Implementation at Dynamic Planner?
What is inflation?
Inflation is the decline of purchasing power of a given currency over time. As is tradition when discussing inflation, this can be demonstrated by the price of Freddos. When I was small, I could buy 10 Freddos for £1. Now I can only buy four. Therefore, my purchasing power has been eroded by Freddoflation.
An estimate of inflation can be reflected in the increase of an average price of a basket of selected goods and services in an economy over a period of time.
The rise in the general level of prices, often expressed as a percentage, is the thing that we state as inflation.
It is of course important to remember that the price of goods can be affected by lots of things, all of which will be captured as ‘inflation’, but could be driven by currency fluctuations, supply issues, increases in business expenditure or any number of different reasons.
Equally, it’s important to recognise that different goods increase in price at different rates, and ‘inflation’, as it is calculated, is only an estimate of the average change in purchasing power.
Freddos have traditionally increased much quicker than inflation, so if your entire basket of goods was made up of Freddos, (please note, this is not a recommendation), your personally experienced inflation level would be much higher than the average inflation level quoted.
What is high inflation?
The Bank of England’s Monetary Policy Committee is responsible for maintaining a target inflation rate, currently set at 2%, although their expectations are that inflation will remain around 5% until April 2022 when it will peak at 6% before gradually returning to the targeted rate.
This level of high inflation is being influenced by emerging from the pandemic, rising consumer energy prices, disruption to supply chains and good shortages.
Of course, the inflation level can’t be allowed to drift forever and the MPC will take measures to reduce inflation through a change in monetary policy. It’s important to note that monetary policy cannot solve supply-side issues, but it can still be used to alter inflation levels in the medium term.
The Committee can choose to change policy in the form of an increase to interest rates, or a reduction in the current quantitative easing programme.
As interest rates rise, borrowing through loans and mortgages becomes more expensive and savings become more profitable. This shifts consumer habits away from spending, reducing demand, and therefore reducing inflation. We’ve already seen one increase in interest rates, making England the first developed nation to increase interest rates following the global pandemic, and more rate rises are expected.
Quantitative easing, which was first introduced in 2009, is where the Bank of England buys back bonds from the private sector, financed by the creation of central bank reserves.
The aim is to increase the price of bonds, by stimulating demand, which will reduce bond yields. As bond yields reduce, so does the interest rates on savings and loans. Therefore, stopping quantitative easing would be expected to reduce the demand of bonds, reducing the price, and increasing the yields. Increasing bond yields will increase interest rates on savings and loans, and thereby lower inflation.
Changes in monetary policies can take up to two years to see their effects fully felt within the economy, so any change in policy will not be a quick fix.
Should I be worried about inflation in financial planning?
With inflation playing such a major role in an individual’s purchasing power, it’s of course vitally important that this is reflected in the advice process, and it is even more necessary when creating a long-term cash flow plan for your clients.
As we see, inflation is not a static number and therefore shouldn’t be modelled as such.
Dynamic Planner forecasts real returns – therefore net of inflation – across its system, in the risk-reward trade-off shown for risk profiling, in investment portfolio reviews and in cash flow planning.
The forecast is generated by a Monte Carlo scenario engine that generates thousands of possible real returns over 49 asset classes. As the returns are real to begin with, the various possibilities for inflation at different times are already factored in. It is therefore inappropriate to guess and factor in other numbers for inflation and apply them to the forecast.
As both the returns and the forecasts are real, you don’t need to worry about inflation – it’s already all accounted for. You can be confident that you are seeing the expected purchasing power of a client’s assets at each point in time, even through these times of increased volatility.
Further to this, the Asset Risk Model and the Dynamic Planner risk profile asset allocations are stress tested to ensure that you can have confidence in our growth assumptions and plan confidently with your client. The stress testing performed in late 2020 focussed purely on inflation and the emergence from the global pandemic.
So, perhaps now is the time to reassure your clients that inflation fluctuations are expected and covered in our modelling, and that their retirement plans will remain on track – as long as they’re planning on purchasing something that isn’t a Freddo.
Read more about Dynamic Planner Cash Flow
by Guy Monson, CIO and Senior Partner, Sarasin & Partners LLP
2021 was a year of unexpectedly strong recoveries. The IMF, for example, in its October 2020 outlook, pencilled in US GDP growth of 3.1% for 2021 – by last quarter that had almost doubled to a red hot 6% (with similar upgrades across much of the developed world). Corporate profits were similarly exceptional, with US earnings for the S&P500 rising 40% from their levels of just a year ago. Perhaps most intriguing was the level of global mergers and acquisitions where, despite virus restrictions and lockdowns, the value of deals agreed in 2021 climbed to the highest levels since records began more than four decades ago . Set against these near bubble conditions, it is not surprising that global equity markets posted a third year of double digit returns and that bond yields rose. Higher inflation was of course the price we paid (UK inflation started the year at 0.7% and ended at 5.1%), but this did not stop 2021 from being another vintage year for equity investors.
After a strong 2020 for us at Sarasin, we found last year more challenging. Yes, we remained overweight equities and underweight bonds (with little net exposure), but we were much more cautious in our stock selection. In particular, we were underweight (relative to the index) the narrow group of US mega-cap companies, mainly technology and consumer names, that led markets higher for much of 2021. We held instead to our long-term thematic positions geared to climate change, automation and ageing. We were by no means absent the digital winners (indeed digitalisation is also one of our themes), we just didn’t hold enough, particularly of the biggest (Apple) or the most fashionable (Tesla). The effect is well illustrated in Chart 1, which shows the performance of the traditional world equity index (weighted by market capitalisation), compared to an equally weighted index where each stock is accorded the same holding size. The underperformance of the latter since the spring of last year is clear and reflects the broad challenges we faced, despite many of our companies posting exceptionally strong growth of both earnings and dividends. So yes, we made good absolute returns for clients, but relative to the index, our performance looks conservative.

So, do we now stick to our cautious equity approach or, do we join the party, and sharply increase our global mega-cap positions? There are arguments for the latter – certainly the largest US companies have consistently delivered superior organic growth, pricing power and prodigious cash flow, all well in excess of the wider index. While this has rightly been rewarded by shareholders, it has now led to some of the most extreme stock-price dispersion and equity concentration in stock market history. Against this backdrop there are three specific issues that concern us:
1. We have hardly started to taper, yet
Last month still saw the world’s central banks buying bonds (QE), at close to record rates – that isn’t exactly tapering, or at least not yet. Things will change though in 2022; the accelerated wind-down of the Federal Reserve’s purchases (QE) will begin in January, while the ECB’s giant pandemic emergency purchase programme (PEPP) ceases in March 2022 (it will be replaced, but with a smaller programme). The Bank of England’s programme has now ended, as have purchases by the Central Bank of Canada. In other words, open-ended QE by western central banks, first deployed in 2009, may soon be history. This, in turn, opens the door to not only interest rate rises (three increases in 2022 and 2023 in the US) but also Quantitative Tightening as Central Banks allow their balance sheets to shrink by letting maturing bonds run off.
This fundamental shift in monetary policy will have huge implications for markets – we should expect volatility to rise, bond yields to trend higher and more speculative investments (some crypto-currencies, for example) to struggle. Equity market leadership will also evolve – in particular, as the inflows of money into the system are reduced, the flows into the mega-cap companies may be impacted, simply because of their sheer size. Highly valued equities also tend to underperform in a rising rate environment, as the discount rate applied to future profits rises. None of this will occur overnight but the direction of travel seems clear.
2. The market impact of Omicron is different this time around
It is now generally accepted that Omicron is more infectious than previous variants but also intrinsically milder. Yes, that means that Omicron will spread much faster and further than earlier waves, but will likely peak much faster too (one South African epidemiologist described it as more of a “flash flood” than a wave). Importantly for those hospitalised, the average hospital stay is up to 50% shorter and fewer need ventilation/ICU support (which is critical given the extreme capacity constraints that remain within hospitals).
This different pattern of infection has implications for global markets. In previous COVID waves, severe lockdowns led to weaker economic growth, but also to lower bond yields and massive central bank support. The result, on balance, was that despite the damage sustained by the real economy, asset prices tended to rise. In particular, generous liquidity conditions, coupled with work-from-home policies, tended to favour the US digital winners and associated global mega-caps. Today, the situation is different; Omicron has thankfully not triggered full scale lockdowns (Asia excepted) but it has meant that central bankers are freer to continue tightening policy, in the face of inflation rates that are far higher than in earlier phases of the crisis. In a worst-case scenario Omicron actually adds to these pressures (through tighter labour markets and supply disruptions).
Such a fundamental shift in the policy response to the virus naturally has implications for market leadership. It suggests that tomorrow’s winners may include more companies that benefit from tighter money (financials), from massive climate spending (industrials) and also those that offer meaningful alternatives to bonds (global income stocks). This is a big transition and again, will not occur overnight, but it is another argument that the leadership we saw last year is not for ever.
3. China – Signs of policy reversal?
2021 was a year where China’s tilt away from the West intensified, including greater assertiveness towards Taiwan, a tighter security regime in Hong Kong and restrictive economic policies targeted at countries such as Lithuania, Canada and Australia. Domestic policy was also challenging; regulators were antagonistic toward internet companies and education providers, while credit and leverage restrictions amplified already severe problems in the property sector. Taken together these policies contributed to a particularly sharp underperformance of Chinese equities, with the MSCI China index lagging the US S&P500 equivalent by an extraordinary 50% last year.
More recently though there have been tentative signs of a policy reversal. The Chinese central bank (PBOC) has now loosened monetary conditions through a reduction in banks’ reserve requirements while vowing, along with all government departments, to take “proactive” moves to ensure “economic stability” – we read this as short-hand for a limited bail-out of the property sector, more loosening of monetary policy and less heavy-handed regulatory intervention. In short it is a policy mix that argues for better returns for China-centric markets in 2022 and potentially for their embattled technology sectors. It is also a reason to suspect that the sharp underperformance of many Asian markets may be reversed – potentially attracting flows that had been destined for the US mega-caps and Nasdaq.
And if inflation rates prove sticky?
All of the above still makes one assumption – namely that global inflation rates fall back only modestly above central bank targets, by 2023. This is still our belief, and certainly a number of factors will combine to push downwards on prices next year. Used-car and gasoline prices rose by more than 50% in 2021 and that’s unlikely to happen again, while bottlenecks in global trade have started to loosen up. If we are wrong though, and risks are clearly to the upside, then there is the real possibility of bond yields climbing sharply or interest rates being tightened more aggressively. Both, in our view, could threaten the high valuations of the US technology and consumer sectors – and the correction could be sudden and aggressive. This is not our base case, but the risks need to be monitored.
In summary, our policy is to remain overweight equities, but to be cautious in our equity selection. Long-term thematic credentials, robust progress on ESG issues and, where possible, sustainable dividend support are the characteristics we are prioritising. When it comes to equity selection in 2022, fortune, we feel, may well favour the cautious.
IMPORTANT INFORMATION
If you are a private investor, you should not act or rely on this document but should contact your professional adviser.
This document has been approved by Sarasin & Partners LLP of Juxon House, 100 St Paul’s Churchyard, London, EC4M 8BU, a limited liability partnership registered in England & Wales with registered number OC329859 which is authorised and regulated by the Financial Conduct Authority with firm reference number 475111.
It has been prepared solely for information purposes and is not a solicitation, or an offer to buy or sell any security. The information on which the document is based has been obtained from sources that we believe to be reliable, and in good faith, but we have not independently verified such information and no representation or warranty, express or implied, is made as to their accuracy. All expressions of opinion are subject to change without notice.</span
Please note that the prices of shares and the income from them can fall as well as rise and you may not get back the amount originally invested. This can be as a result of market movements and also of variations in the exchange rates between currencies. Past performance is not a guide to future returns and may not be repeated.
Neither Sarasin & Partners LLP nor any other member of the Bank J. Safra Sarasin group accepts any liability or responsibility whatsoever for any consequential loss of any kind arising out of the use of this document or any part of its contents. The use of this document should not be regarded as a substitute for the exercise by the recipient of his or her own judgment. Sarasin & Partners LLP and/or any person connected with it may act upon or make use of the material referred to herein and/or any of the information upon which it is based, prior to publication of this document. If you are a private investor you should not rely on this document but should contact your professional adviser.
Neither MSCI nor any other party involved in or related to compiling, computing or creating the MSCI data makes any express or implied warranties or representations with respect to such data (or the results to be obtained by the use thereof), and all such parties hereby expressly disclaim all warranties of originality, accuracy, completeness, merchantability or fitness for a particular purpose with respect of any such data. Without limiting any of the foregoing, in no event shall MSCI, any of its affiliates or any third party involved in or related to compiling, computing or creating the data have any liability for any direct. indirect, special, punitive, consequential or any other damages (including lost profits) even if notified of the possibility of such damages. No further distribution or dissemination of the MSCI data is permitted without MSCI’s express written consent.
© 2022 Sarasin & Partners LLP – all rights reserved. This document can only be distributed or reproduced with permission from Sarasin & Partners LLP. Please contact marketing@sarasin.co.uk.
By Jim Leaviss, Fund Manager at M&G Investments
After a tumultuous year for fixed income markets, fund manager Jim Leaviss presents his outlook for 2022. Jim considers the outlook for inflation and what this means for central bank policy and financial markets. He also looks at some of the more recent macro developments, such as the emergence of the Omicron variant, a hawkish pivot from the Federal Reserve and a rate hike from the Bank of England.
The value and income from a fund’s assets will go down as well as up. This will cause the value of your investment to fall as well as rise and you may get back less than you originally invested. Where any performance is mentioned, please note that past performance is not a guide to future performance.
Inflation – The dominant theme in 2021
If I had been asked at the beginning of the year where yields would be if US inflation were to hit 6.8% ‒ the highest since 1982 ‒ I wouldn’t have believed that 10-year Treasuries would be yielding just 1.4%. In the UK, the Retail Prices Index (RPI) reached 7.1%, yet 10-year gilt yields remain stuck at around 0.8%. Real yields are therefore in deeply negative territory.
It’s a similar story in the US Treasury Inflation Protected Securities (TIPS) market, with inflation breakevens having seen only modest rises this year. While 5-year US breakevens did climb to around 3.2% earlier in the year on the back of rising oil prices, they have since eased back to around 2.7%, which compares with around 2% at the start of the year.
Looking at the 5y5y breakeven rates (which shows us what inflation breakevens are expected to be 5 years from now, thus removing all of the COVID noise), we can see these are only modestly higher over the year, from 2% in January to around 2.5% now (see Figure 1). All of this clearly suggests that the market thinks inflation will be transitory.
Figure 1. 5y5y inflation swap: market’s expectation of 5-year inflation, in 5 years
US 5y5y inflation swap
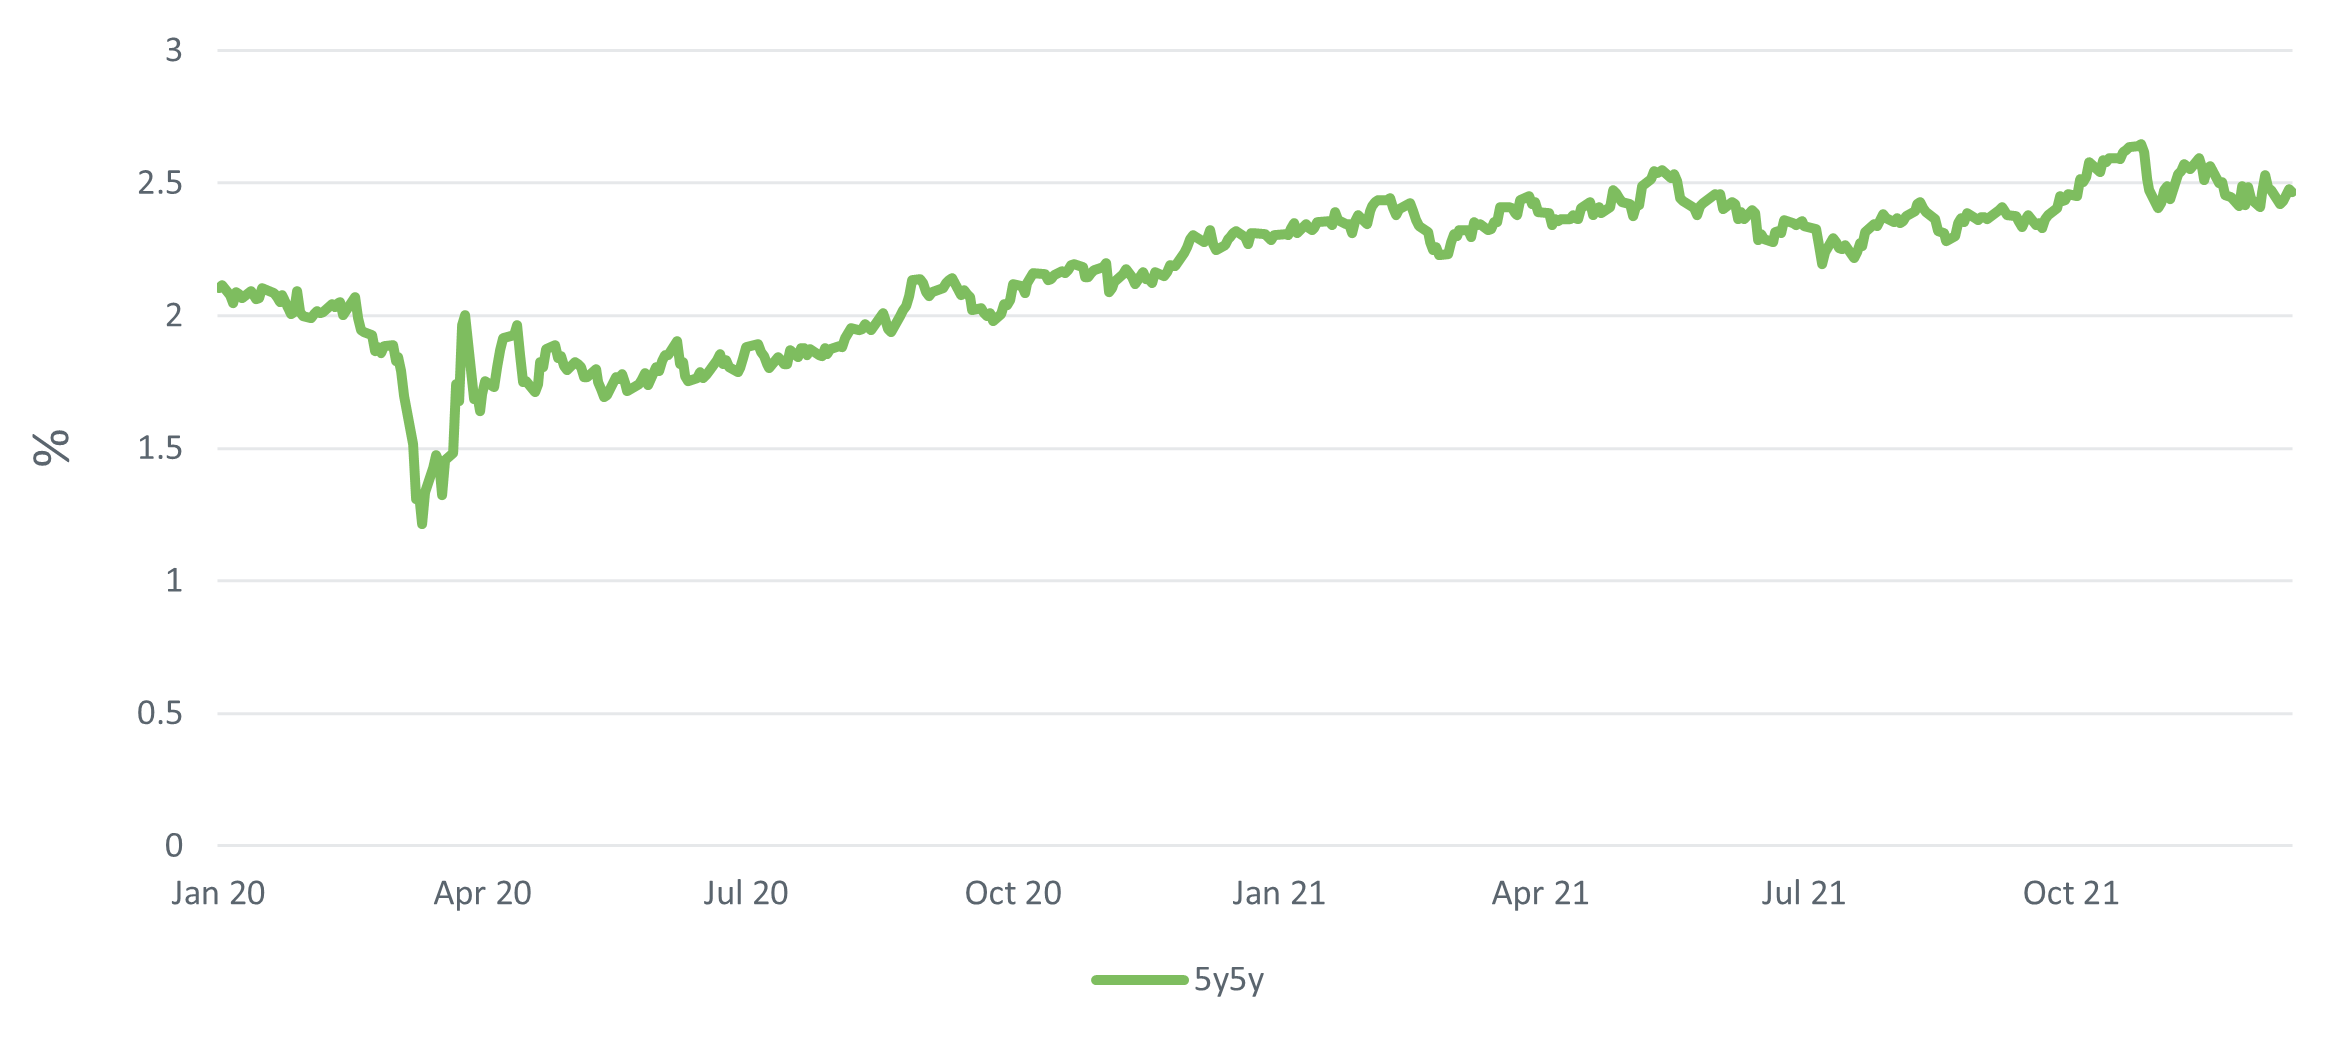
Source: Bloomberg, 18 December 2021.
Past performance is not a guide to future performance
To a certain extent, this downward trajectory in inflation is baked in, with inflation likely to moderate from its current high levels. For instance, unless we see another doubling in oil prices, base effects will start to fall out of the equation over the next few months. Meanwhile, new manufacturing capacity coming on line should help reduce product costs – after all, semiconductors cannot be stuck on ships forever – and this will help bring down the prices of things such as new cars.
Wages are a key driver of inflation over the longer term, but, so far, we see little evidence of a 1970s-style wage price spiral. While increases in the US minimum wage could have some impact, union representation remains very low, and the rise of the gig economy is likely to continue to suppress wages.
Inflation is also likely to be an increasingly dominant issue from a political perspective. Indeed, in the 1980s inflation was the number one election issue, and I can see inflation becoming a hot topic once again as we approach the mid-term elections in 2022.
Central bank watch
US Federal Reserve (Fed): the December meeting saw a hawkish pivot from the Fed, with inflation very much the dominant theme. The Fed ‘dot plots’ now indicate three 0.25% rate hikes in 2022, followed by another three in 2023 and another two in 2024. This equates to a 2% tightening over the next three years, which was slightly more than anticipated.
The Fed also increased the tapering of its bond purchases by $30bn, with tapering set to end altogether by March 2022. So far, the bond market reaction has been very muted and certainly nothing to compare with the sell-off we saw during the ‘taper tantrum’ of 2013.
From a valuation perspective, we think US Treasuries currently look about fairly priced, with forward-looking yields now broadly in line with the Fed’s long-term expectations for rates (see Figure 2).
Figure 2. 10-year US Treasuries 10-year forward
Forward-looking yields versus the Fed’s long-term expectations
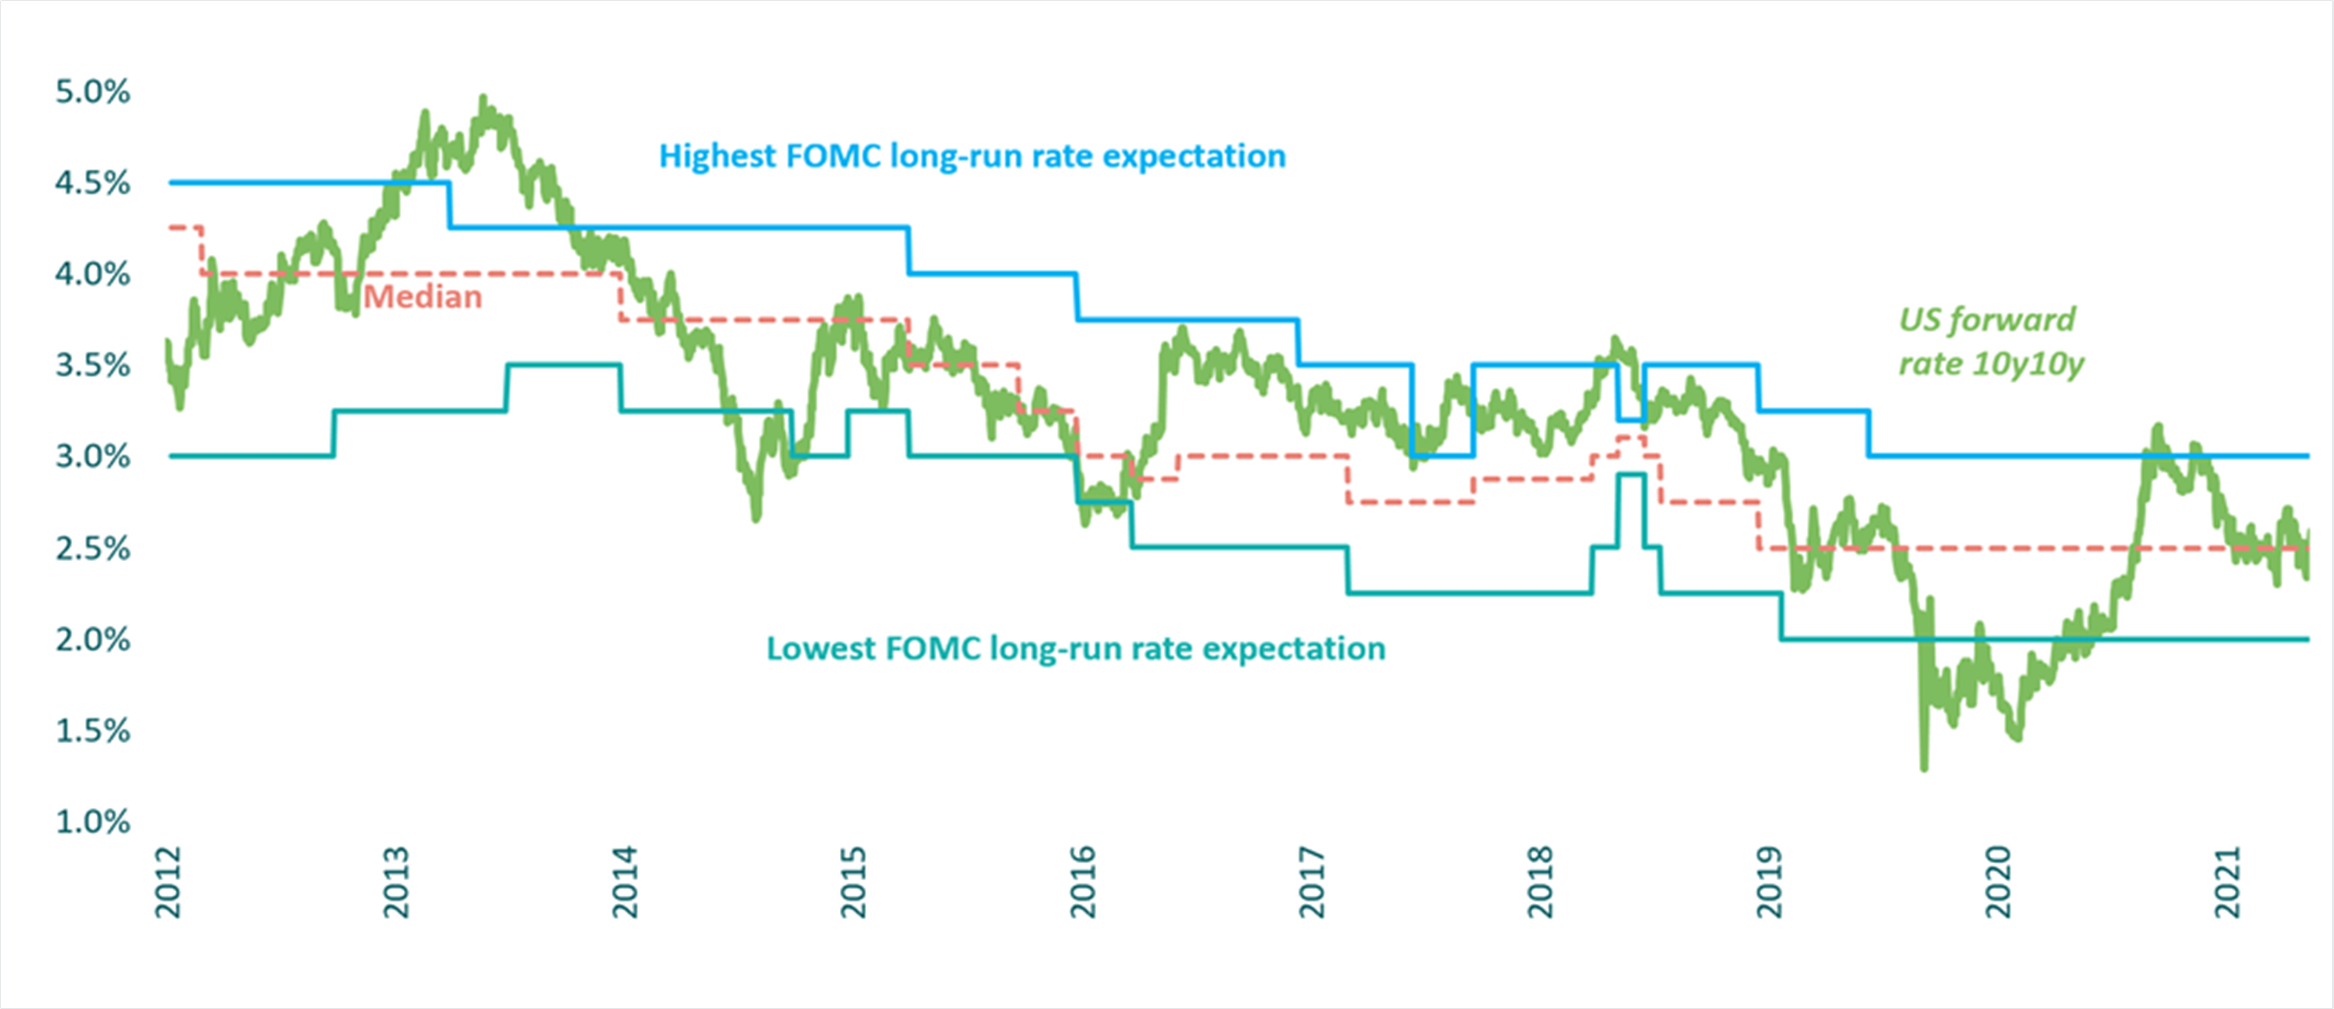
Source: Bloomberg, Federal Reserve, 17 December 2021.
Past performance is not a guide to future performance
European Central Bank (ECB): we also see a slightly more hawkish response at the latest meeting, with the ECB announcing a cut in its bond buying under its Pandemic Emergency Purchase Programme (PEPP). That said, the ECB has left itself some flexibility to adjust this programme if the outlook deteriorates. It is worth noting that the inflationary backdrop in the eurozone is very different from the US and the UK, with the region seeing much lower levels of inflation so far.
Bank of England (BoE): the bank recently hiked rates to 0.25% in response to the recent high CPI reading. However, this seems to overlook the fact that the UK is in the process of closing down its economy, while recent GDP figures suggested the UK economy was already slowing. Some commentators have suggested a possible policy error here, and it is unclear why the BoE has not waited until the impact of the Omicron variant was a bit clearer before making this decision.
Omicron – Economic impact could be underestimated
The emergence of the new Omicron variant of COVID-19 sent jitters through financial markets in the final weeks of 2021, leading to a sell-off in parts of the credit market. The new strain appears highly virulent, with hospitalisations almost certain to increase due to the sheer number of new cases. However, compared to this time last year there are grounds for some optimism given the high level of vaccinations and new treatments.
That said, we could be at risk of underestimating the economic damage the new variant will cause, especially in light of recent soft economic data in the UK. GDP is still well below its pre-COVID trend, and this could be exacerbated by wages failing to keep pace with inflation.
It is a similar story in the US, where we have seen a recent downturn in consumer confidence and weak retail sales. These are traditionally reliable lead indicators, and we shouldn’t completely dismiss the risk of a recession in 2022. A flattening yield curve is another bearish signal which needs to be considered.
What happens after a rate hike cycle begins?
Research from Deutsche Bank takes a look at what has previously happened in the years following the start of a new rate hiking cycle. The research suggests that it generally takes three years after the first hike for a recession to hit. In the meantime, government bond yields tend to rise on average by 111 bps in the first year following a hike, before falling back over the following two years (see Figure 3).
Figure 3. The year after the Fed hikes
Average BBB credit spreads performance in Fed tightening cycles since 1955 by month
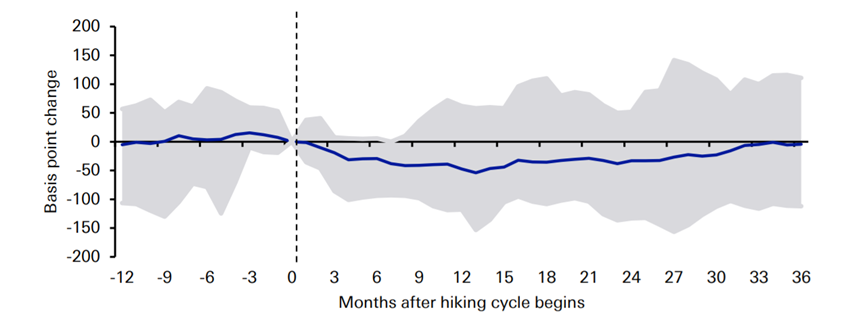
Source: Deutsche Bank Research (Jim Reid et al.), GFC, Haver Analytics – “When the Fed hikes”, December 2021. Grey shaded area represents range of outcomes in hiking cycles analysed.
Past performance is not a guide to future performance
Meanwhile, equities rally by an average 7.7% in the 250 days after the first hike, before giving back these gains over the rest of the year. Credit usually follows the path of equities, with spreads initially tightening, before widening back to their starting point in three years’ time. Of course, it should be highlighted that the starting point for credit is already very tight, so spreads perhaps may not see the initial 49bps tightening they have seen historically.
Can central banks really influence inflation?
There is much debate as to whether rate hikes can really dampen inflationary pressures. Higher rates will clearly have no direct impact on oil prices or supply-chain bottlenecks, the two big drivers of inflation this year. The majority of mortgages are now fixed – both in the US and the UK – so there will be no immediate impact through that mechanism.
Central banks took a lot of the credit for the fall in inflation since the 1980s, but in reality this was largely driven by other factors, such as globalisation and technology. The fact is, it is not clear how far rates really influence inflation, and how much central banks will really be able to do if inflation does get out of control.
Credit – A world of rising stars
We are currently in a world of ‘rising stars’, as opposed to the ‘fallen angels’ backdrop of 2020. We are currently seeing around $20bn a month of companies being upgraded from junk to investment grade, and the Bank of America expects to see a further $70bn worth of upgrades next year.
Another key trend in 2021 has been the return of dispersion. The months following the pandemic saw indiscriminate tightening across credit, but we are now seeing more diffusion between individual credits and sectors. This is especially apparent in the high yield space, where we are seeing the clear emergence of good credits and bad credits.
Looking at fundamentals, leverage has come down a bit in 2021 from last year. However, this is off a very high base, and debt relative to earnings is still twice as high as it was in 2010. Defaults remain very low, with default rates of less than 1% in the high yield space. From a regional perspective, US credit continues to offer a meaningful spread pick-up versus other regions, even after currency hedging costs are factored in.
Environmental, social and governance (ESG) continues to be a growing and important trend in global bond markets. In 2022, we expect to see further significant issuance in the ESG bond space, particularly sustainability-linked bonds and green bonds. While Europe has traditionally led the way in the sustainable investment area, we are also seeing increasing interest in the US.
As we look ahead to the new year, we would also highlight the so-called ‘January effect’. Typically, technical drivers have often led to outperformance for credit at the beginning of the year. This could be due to a variety of factors, such as macro investors being short credit relative to equities, and looking to rebalance their portfolios at the start of the year.
Emerging markets and currencies
It was a challenging year for emerging markets in 2021, dominated by themes such as the Evergrande debt crisis in China, COVID worries amid low vaccination rates, and rising inflation. Turkey was the big story as the lira collapsed by more than 50%.
Many EM local currencies got hammered, including many with reasonably solid fundamentals, such as the Mexican peso, which as an oil producer should have benefited from the recent rise in energy prices. If one is prepared to accept volatility, we do think EM contain many areas that offer attractive positive real yield.
It was also the year of the US dollar which was up against almost everything. This anticipated the likelihood of future Fed rate hikes, although dollar bullishness is starting to appear something of a consensus and the currency does appear expensive on some valuation metrics, such as Real Effective Exchange Rates (REER).
Looking at the OECD’s Purchasing Power Parity (PPP) measure, the euro is around 26% undervalued, while the Japanese yen, sterling and Mexican peso also appear somewhat cheap. As per the norm, the Swiss franc looks expensive, along with the Norwegian krone and Australian dollar (see Figure 4).
Figure 4. Currency valuations globally
Trade based valuations
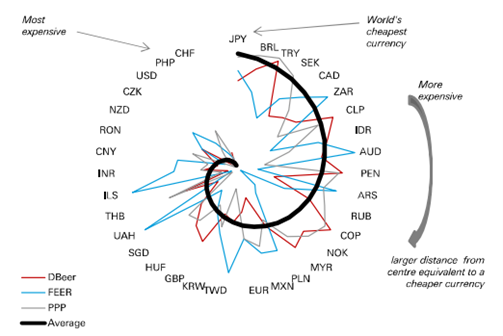
Source: Bloomberg, 17 December 2021.
Currency valuation models key: DBeer = behavioural equilibrium exchange rate (Deutsche Bank); FEER = fundamental equilibrium exchange rate; PPP = purchase price parity
Another currency that looks strong is the Chinese renminbi. Potential intervention from the People’s Bank of China (PBOC) to weaken the currency could be something to watch out for in 2022.
An extraordinary time for bond investors
We are living through extraordinary times in bond markets. Despite US inflation heading above 6%, 30-year bond yields remain below 2%, while credit spreads remain near all-time tights. At face value, fixed income valuations don’t look very compelling, although we do think that pockets of value can be found.
In terms of fixed income assets that might do well in an inflationary, rising rate environment, we continue to see attractions in inflation-linked bonds, such as US TIPS. Another area which I think could do well is emerging market bonds. In contrast to the negative real yields in traditional developed markets bonds, emerging market bonds can provide positive real yields of around 2-3%. There’s going to be a lot of risk and volatility as always when investing in emerging market bonds, but in terms of valuation that probably looks the best place to be in fixed income at the moment.
2022 is likely to be the year when we find out whether inflation proves to be transitory or looks to become more permanent, and this is likely to be a key driver for fixed income markets. It will also be fascinating to see whether the high valuations across risk assets – such as equities and high yield bonds – can be sustained as the huge levels of monetary stimulus start to be reined in.
M&G
December 2021
The views expressed in this document should not be taken as a recommendation, advice or forecast. The views expressed in this document should not be taken as a recommendation, advice or forecast.
For Investment Professionals, Institutional Investors and Professional Investors only. Not for onward distribution. No other persons should rely on any information contained within. This information is not an offer or solicitation of an offer for the purchase of shares in any of M&G’s funds. Distribution of this document in or from Switzerland is not permissible with the exception of the distribution to Qualified Investors according to the Swiss Collective Investment Schemes Act, the Swiss Collective Investment Schemes Ordinance and the respective Circular issued by the Swiss supervisory authority (“Qualified Investors”). Supplied for the use by the initial recipient (provided it is a Qualified Investor) only. In Hong Kong, this financial promotion is issued by M&G Investments (Hong Kong) Limited, Office: Unit 1002, LHT Tower, 31 Queen’s Road Central, Hong Kong; in Singapore, by M&G Investments (Singapore) Pte. Ltd. (Co. Reg. No. 201131425R), regulated by the Monetary Authority of Singapore; in Switzerland, by M&G International Investments Switzerland AG, Talstrasse 66, 8001 Zurich, authorised and regulated by the Swiss Federal Financial Market Supervisory Authority; elsewhere by M&G International Investments S.A. Registered Office: 16, boulevard Royal, L 2449, Luxembourg. For Hong Kong only: If you have any questions about this financial promotion, please contact M&G Investments (Hong Kong) Limited. For Singapore only: All forms of investments carry risks. Such investments may not be suitable for everyone. The information contained herein is provided for information purposes only and does not constitute an offer of, or solicitation for, a purchase or sale of any investment product or class of investment products, and should not be relied upon as financial advice. The Portuguese Securities Market Commission (Comissão do Mercado de Valores Mobiliários, the “CMVM”) has received a passporting notification under Directive 2009/65/EC of the European Parliament and of the Council and the Commission Regulation (EU) 584/2010 enabling the fund to be distributed to the public in Portugal. M&G International Investments S.A. is duly passported into Portugal to provide certain investment services in such jurisdiction on a cross-border basis and is registered for such purposes with the CMVM and is therefore authorised to conduct the marketing (comercialização) of funds in Portugal. For Taiwan only: The information contained herein has not been reviewed or approved by the competent authorities and is not subject to any filing or reporting requirement. The information offered herein is only permitted to be provided to customers of an offshore banking unit of a bank (“OBU”)/offshore securities unit of a securities firm (“OSU”) which customers reside outside the R.O.C. Customers of an OBU/OSU are not eligible to use the financial consumer dispute resolution mechanism under the Financial Consumer Protection Law. Products offered by M&G International Investments S.A. may be made available for purchase by Taiwan OBUs/OSUs acting on behalf of non-Taiwan customers of such units but may not otherwise be offered or sold in Taiwan.
656603_PE_SG_HK_TWN