
A weak manufacturing survey in Germany has sharpened the focus of markets towards the extent of the global economic slowdown. German manufacturing PMI recently fell to 44.7, the second lowest since 2009, and versus an expected number of 48 (anything below 50 is considered to be consistent with contraction). Meanwhile, the new orders sub-index, a leading indicator of the leading indicator, fell to 40.1, the lowest since the GFC. Things look bleak for the ‘powerhouse’ of Europe, with its manufacturing particularly geared into the global economy.
Looking at the global slowdown, in the absence of any inflation, or any sensible answers from politicians, central banks seem to be standing ready with the next round of QE, now considered an established part of the central bank tool kit. This is despite many, if not most, observers believing it to be of limited use to the real economy in the first order, with the second order impact on the real economy being via, essentially, a distortion of asset prices. Criticism has been somewhat muted, in part as the distortion has been to drive asset prices higher and that keeps many happy: look no further than the fund management industry, where revenues are generally boosted by higher asset prices.
Nevertheless, there is a growing belief that the benefits of QE are unclear, whilst the unintended consequences of QE are unhelpful in generating sustainable economic growth. The chart below looks at the share of wealth across US households over the last 100 years, specifically, the share of wealth by the bottom 90% versus the top 0.1%. Both lines diverged somewhat in the majority of the post WWII years, until the 1980s, when the two groups began an extended period of convergence. A number of dynamics kicked in during the post 1980/90s period, but two were particularly notable, and they are related.
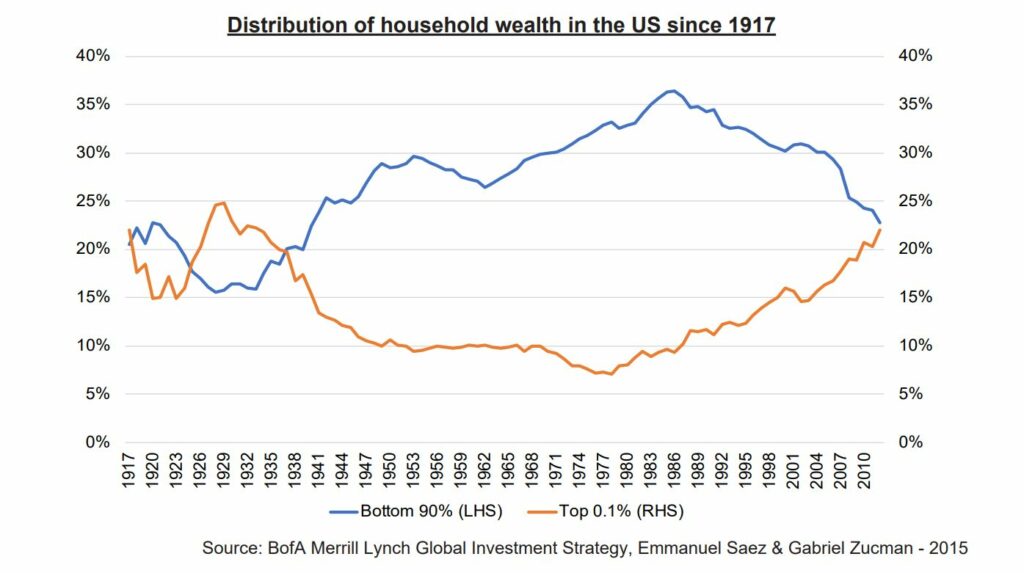
First, central bank rates started to trend lower, kicked-off by the Greenspan put from the late 1980s, where the Fed set a precedent that they would intervene in a crisis, thereby encouraging elevated risk-taking. Of course this carried on well beyond Greenspan’s tenure and eventually morphed into QE. As one of the consequences of this strategy has been to support/elevate asset prices, it has disproportionately benefited those with more assets. Second, consumer price inflation remained broadly subdued, in part due to the Chinese economy joining the WTO in 2001, exporting deflationary pressures globally. This allowed central banks to look beyond inflation, one of their key concerns in the 70s and early 80s. The arrival of the Chinese labour force on the world stage, as well as the steady reduction in trade union membership since the 1980s, also kept a lid on wages growth in western economies, contributing further to the concentration of wealth.
This growing sense of inequality doesn’t sit well with many voters, particularly the 90%, and is at least partly behind the extraordinary rise in populism in recent years. The data behind the graph are not new but with central banks poised to act, the unintended consequences will no doubt become a focus again.
What has it meant for markets? Well, the Fed pause has boosted financial assets since the beginning of the year and eased financial conditions generally. More recently, the weaker economic growth numbers, especially the German numbers last week, as well as dovish statements from central banks, have pushed longer dated government bond yields lower. For example, this led to more parts of the US yield curve inverting, though not yet the most reliable indicator of recession, which is the 2s10s inversion. Meanwhile, the German 10 year yield fell below zero for the first time since 2016.
Going forward, we expect the Fed to be the major driver across assets, and we expect politics to remain central. In fact, we’d go further than that and say that central banks and politicians will become increasingly entwined, note Trump’s recent Fed nominee. A slowing global economy will only push central banks and politicians further into the spotlight.
Anthony Rayner, Miton Multi Asset team, 28/03/2019
Guest article supplied by Miton Asset Management
Risks:
The value of stock market investments will fluctuate and investors may not get back the original amount invested.
Past performance is not a guide to future performance.
Forecasts are not reliable indicators of future performance.
Important Information: