Who are CAM? What do we do?
City Asset Management (CAM) exists to increase the real wealth of clients. We achieve this through a rigorous real return investment management process, combined with an exceptional level of personal service.
Being outcome focused investors, our core multi-asset investment services are designed to outperform inflation-plus benchmarks over the investment cycle to achieve the fundamental aim of genuine wealth creation.
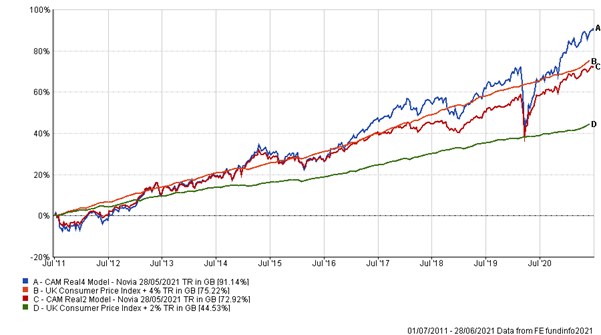
Capital preservation is a key consideration, so we seek returns that have lower correlation and reduced volatility relative to major equity and bond markets. The 10th anniversary of our real return multi-asset MPS is an appropriate milestone for some reflection and comment.
Why do we benchmark against CPI?
To create real wealth, your clients’ assets need to grow by more than inflation. Therefore, we aim to grow your clients’ portfolios at a higher rate than inflation, measured by the Consumer Price Index (CPI) and according to their risk profile. We believe that investment success should achieve something meaningful, such as increased purchasing power via increased real wealth, which in turn can help you to fulfil your clients’ objectives.
How is CPI calculated and why is it relevant?
Consumer price inflation is the rate at which the prices of goods and services bought by most UK households rise or fall. The government uses CPI as the basis for its inflation target. A good way of thinking about this is to imagine a shopping trolley containing those goods and services. As the prices of the various items in the trolley change over time, so does the total cost of its contents.
Ideally, the basket would contain all consumer goods and services purchased by households and the prices measured for every vendor that sells them. In practice, the consumer price indices are calculated by collecting a sample of prices for a selection of representative goods and services in a range of UK retail locations, including the internet.
Currently, around 180,000 separate price quotations are gathered every month to compile the indices, covering over 720 representative consumer goods and services. These prices are collected in around 140 locations throughout the UK, online and over the phone.
Comparison of a basket of goods in 2011 versus 2021
| Examples | In | Out |
| 2011 | Mobile Phone Apps | Vending machine cigarettes |
| Smart Phones | Rose Bushes | |
| Hair Conditioner | Pork Shoulder | |
| 2021 | Electric/Hybrid Cars | Ground coffee |
| Hand Hygiene Gel | Carpet Axminster/Wilton | |
| Men’s Loungewear | Pure fruit smoothie | |
| Smart Watches | White chocolate bar |
We are reminded that past performance is ‘no guide… etc’. However, it is what most investment professionals use as a starting point when assessing an investment strategy.
Looking back over the last decade, we should ask the question, ‘Did we provide the outcome we sought for advisers’ clients?’ In short, no, we did not. We are guilty of over delivering; all targets were exceeded as can be seen in the chart below.
Shrinkflation
Reducing the weight, volume, or quantity of the products, while keeping the same retail price tag, prevents sales volume from being affected. The average consumer will not notice a small reduction in quantity. However, if this continues over time, then the changes become more obvious to consumers.
Rising production costs are generally the primary cause of shrinkflation. Increases in the cost of ingredients or raw materials, energy commodities and labour increase production costs and subsequently diminish the profit margins of producers.
Shrinkflation is a rise in the general price level of goods per unit of weight or volume, brought about by a reduction in the weight or size of the item sold. The price for one piece of the packaged product remains the same or could even be raised.
Essentially, shrinkflation is a form of hidden inflation. The rise in the price level signifies that the currency in each economy loses purchasing power (i.e., less can be bought with the same amount of money). The absolute price of the product does not go up, but the price per unit of weight or volume has increased.
In July 2015, a tub of Cadbury Roses which weighed 975g in 2011 was reduced to under 730g, while a tub of Cadbury Heroes was reduced to 695g. However, the price remained the same at around £9.
In 2016, manufacturers reduced the size of the UK 170g Toblerone bar to 150g, while the 400g bar was reduced to 360g. This was done by enlarging the gap between the chocolate triangles.
In 2017, McVitie’s reduced the number of Jaffa Cakes in every standard packet from 12 to 10, raising the cost per cake from 9.58p to 9.9p
What is considered a good hedge against inflation? Gold? House Prices? These are all single assets and therefore potentially more volatile. What about against those important things in life? Wages or a pint.
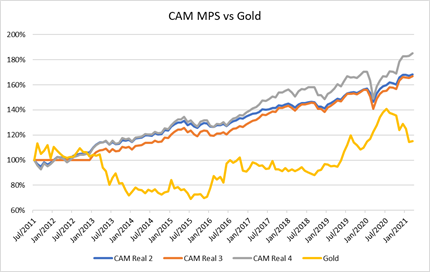
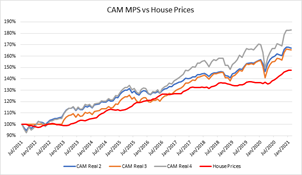
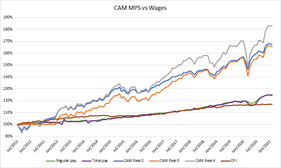
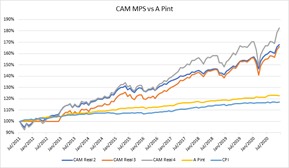
In conclusion, a diversified multi asset portfolio can reduce volatility versus a single asset class and generate out performance over inflation. We hope you enjoyed our look at inflation. For further information, visit www.city-asset.co.uk