By Cantab Asset Management
The last decade has seen significant asset price appreciation, accommodated by expansionary monetary policy. Alongside this, periods of uncertainty have led to spikes in volatility. Whilst recent levels of Quantitative Easing are unprecedented in historical terms, volatility and market corrections are not. This note considers the relationship between active management and market volatility in the context of achieving strong long-term performance. The main takeaways from the following analysis are:
- The actively managed funds tended to exhibit higher volatility than their passive peers
- Over each period of heightened volatility, the actively managed funds tended to outperform their passive peers
- Over the full period, the actively managed funds all materially outperformed their passive peers
- Despite higher levels of volatility, the actively managed funds tended to prove more resilient than their passive peers from a maximum drawdown perspective. This demonstrates one challenge associated with relying on volatility alone as a measure of risk – it captures upside as well as downside movements
- Similar results were obtained when comparing the actively managed Cantab multi-asset portfolio to a passive peer
Analysis
The VIX index is used by investors as a measure of implied volatility in financial markets. It is based on S&P500 option prices and is commonly referred to as the “Fear Index”. Between 2018 and 2021, the VIX has breached level 20, which is considered to be ‘high’, on four occasions, as illustrated below.
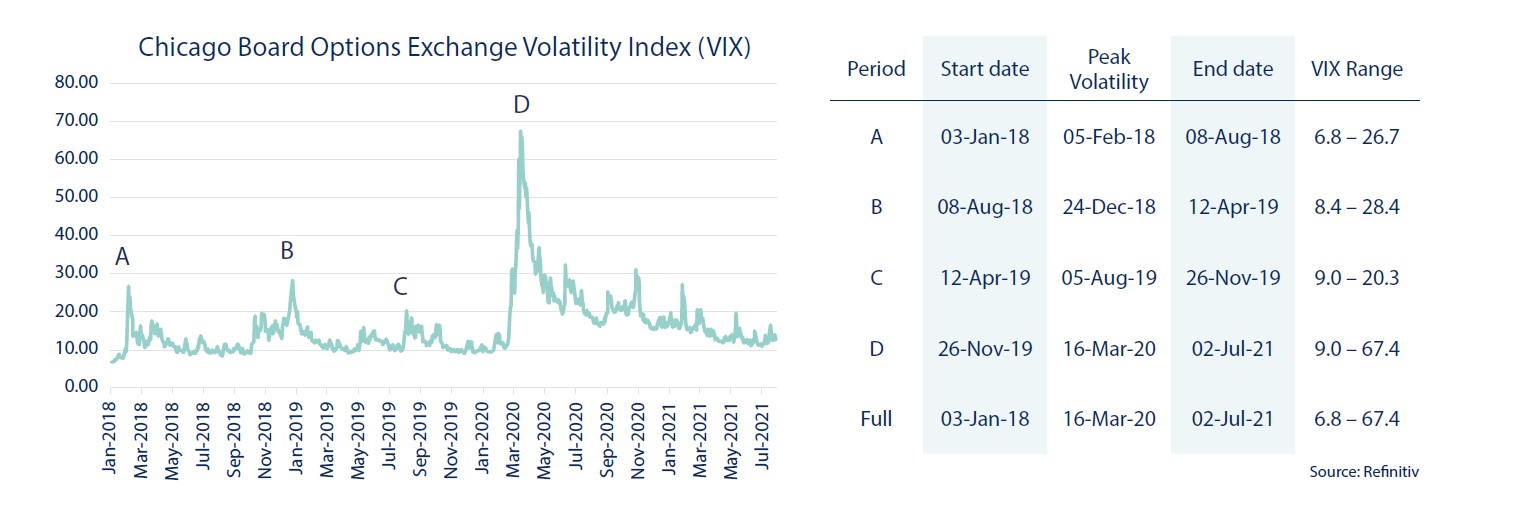 Each of the four highlighted periods captures a date range in which the index level moved from low-to-high-to-low and is used as a proxy for short-term market volatility. Performance during these periods is illustrated below, alongside commonly-used risk metrics for three actively managed funds and their respective passive alternatives.
 Summary
These findings may or may not be representative of the entire active universe of funds; to test them is beyond the scope of this analysis. What is clear however, is that within the universe of actively managed funds, there are options that provide significant outperformance on a risk–adjusted basis during periods of heightened volatility. It is our role as advisors to identify and monitor these.
When applying the same analysis to the actively managed Cantab multi-asset portfolio, not only did the portfolio outperform its passive equivalent over the full period but also achieved relatively similar volatility and max drawdown metrics overall. The analysis also found that after a material peak-to-trough movement, the actively managed Cantab portfolio recovered considerably faster to previous highs when compared to the passive equivalent.
The results from the analysis not only highlight the importance of taking a long-term view, but also demonstrate that there are two sides to volatility: downside and upside. Volatility is usually calculated using variance or standard deviation, by summing the square of the deviation of returns from the mean return and dividing by the number of observations in the data set. By definition, upside and downside deviations are treated equally. Whilst higher volatility implies higher risk, due to less predictability of asset pricing, investors are typically in favour of upside volatility in practice. By pursuing a passive strategy, investors avoid the downside risk of underperforming a benchmark index; unfortunately, they also miss out on the upside potential of outperformance.
Periods of short-term volatility have been common throughout history and will continue to be common in the future. However, during such periods, investors tend to focus on the negative side of volatility rather than directing their focus to the bright side of volatility that is offered by good active management.
Notes:
- Both the start and end dates for each of the respective volatility periods were obtained by identifying the lowest VIX level before and after breaching level 20. A VIX level of below 12 is considered low, a level exceeding 20 is considered high.
- The Vanguard fund was selected based on similar equity exposure to the Cantab portfolio for comparison.
- Cantab’s Managed Portfolio Service (MPS) performance data is presented net of 0.36% pa MPS fees which do not attract VA
Risk warnings:
This content has been prepared based on our understanding of current UK law and HM Revenue and Customs practice, both of which may be the subject of change in the future. The opinions expressed herein are those of Cantab Asset Management Ltd and should not be construed as investment advice. Cantab Asset Management Ltd is authorised and regulated by the Financial Conduct Authority. As with all equity-based and bond-based investments, the value and the income therefrom can fall as well as rise and you may not get back all the money that you invested. The value of overseas securities will be influenced by the exchange rate used to convert these to sterling. Investments in stocks and shares should therefore be viewed as a medium to long-term investment. Past performance is not a guide to the future. It is important to note that in selecting ESG investments, a screening out process has taken place which eliminates many investments potentially providing good financial returns. By reducing the universe of possible investments, the investment performance of ESG portfolios might be less than that potentially produced by selecting from the larger unscreened universe.